

This is a heading
This is a subheading 123
this is some text which will go here
This news article is more than 12 months old and some of the information may be out of date - please see our latest news articles here.
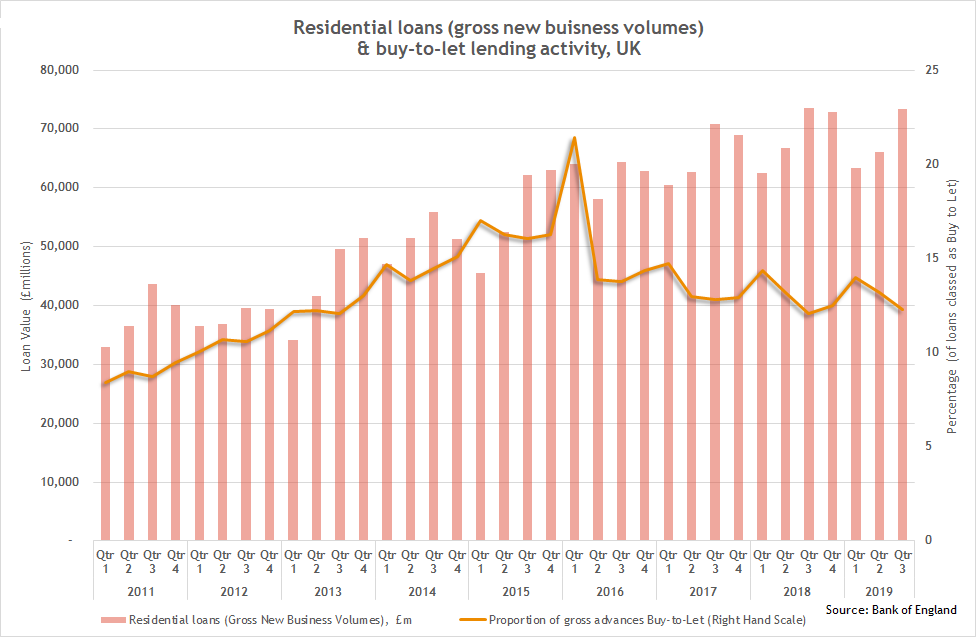
Chart 1 below shows the gross value of new residential loans, as well as the proportion of residential loans going into the buy-to-let market.
These flows are focused on the smaller, individual investor and so provide an insight into confidence in the PRS segment served by NRLA members.
This post was authored by Nick Clay of the NRLA. The views, analysis and interpretation of the data are his and not necessarily those of the NRLA.
Note that the data presented here is subject to revision. Sand updates. Such revisions may render the analysis null and void in the future.